

Report and analysis
The report compares what was counted with the warehouse stock, and the analysis shows how the count went and who counted how much. Both open with the Report and Analysis buttons on the count page and are available while the count is still running.
Report
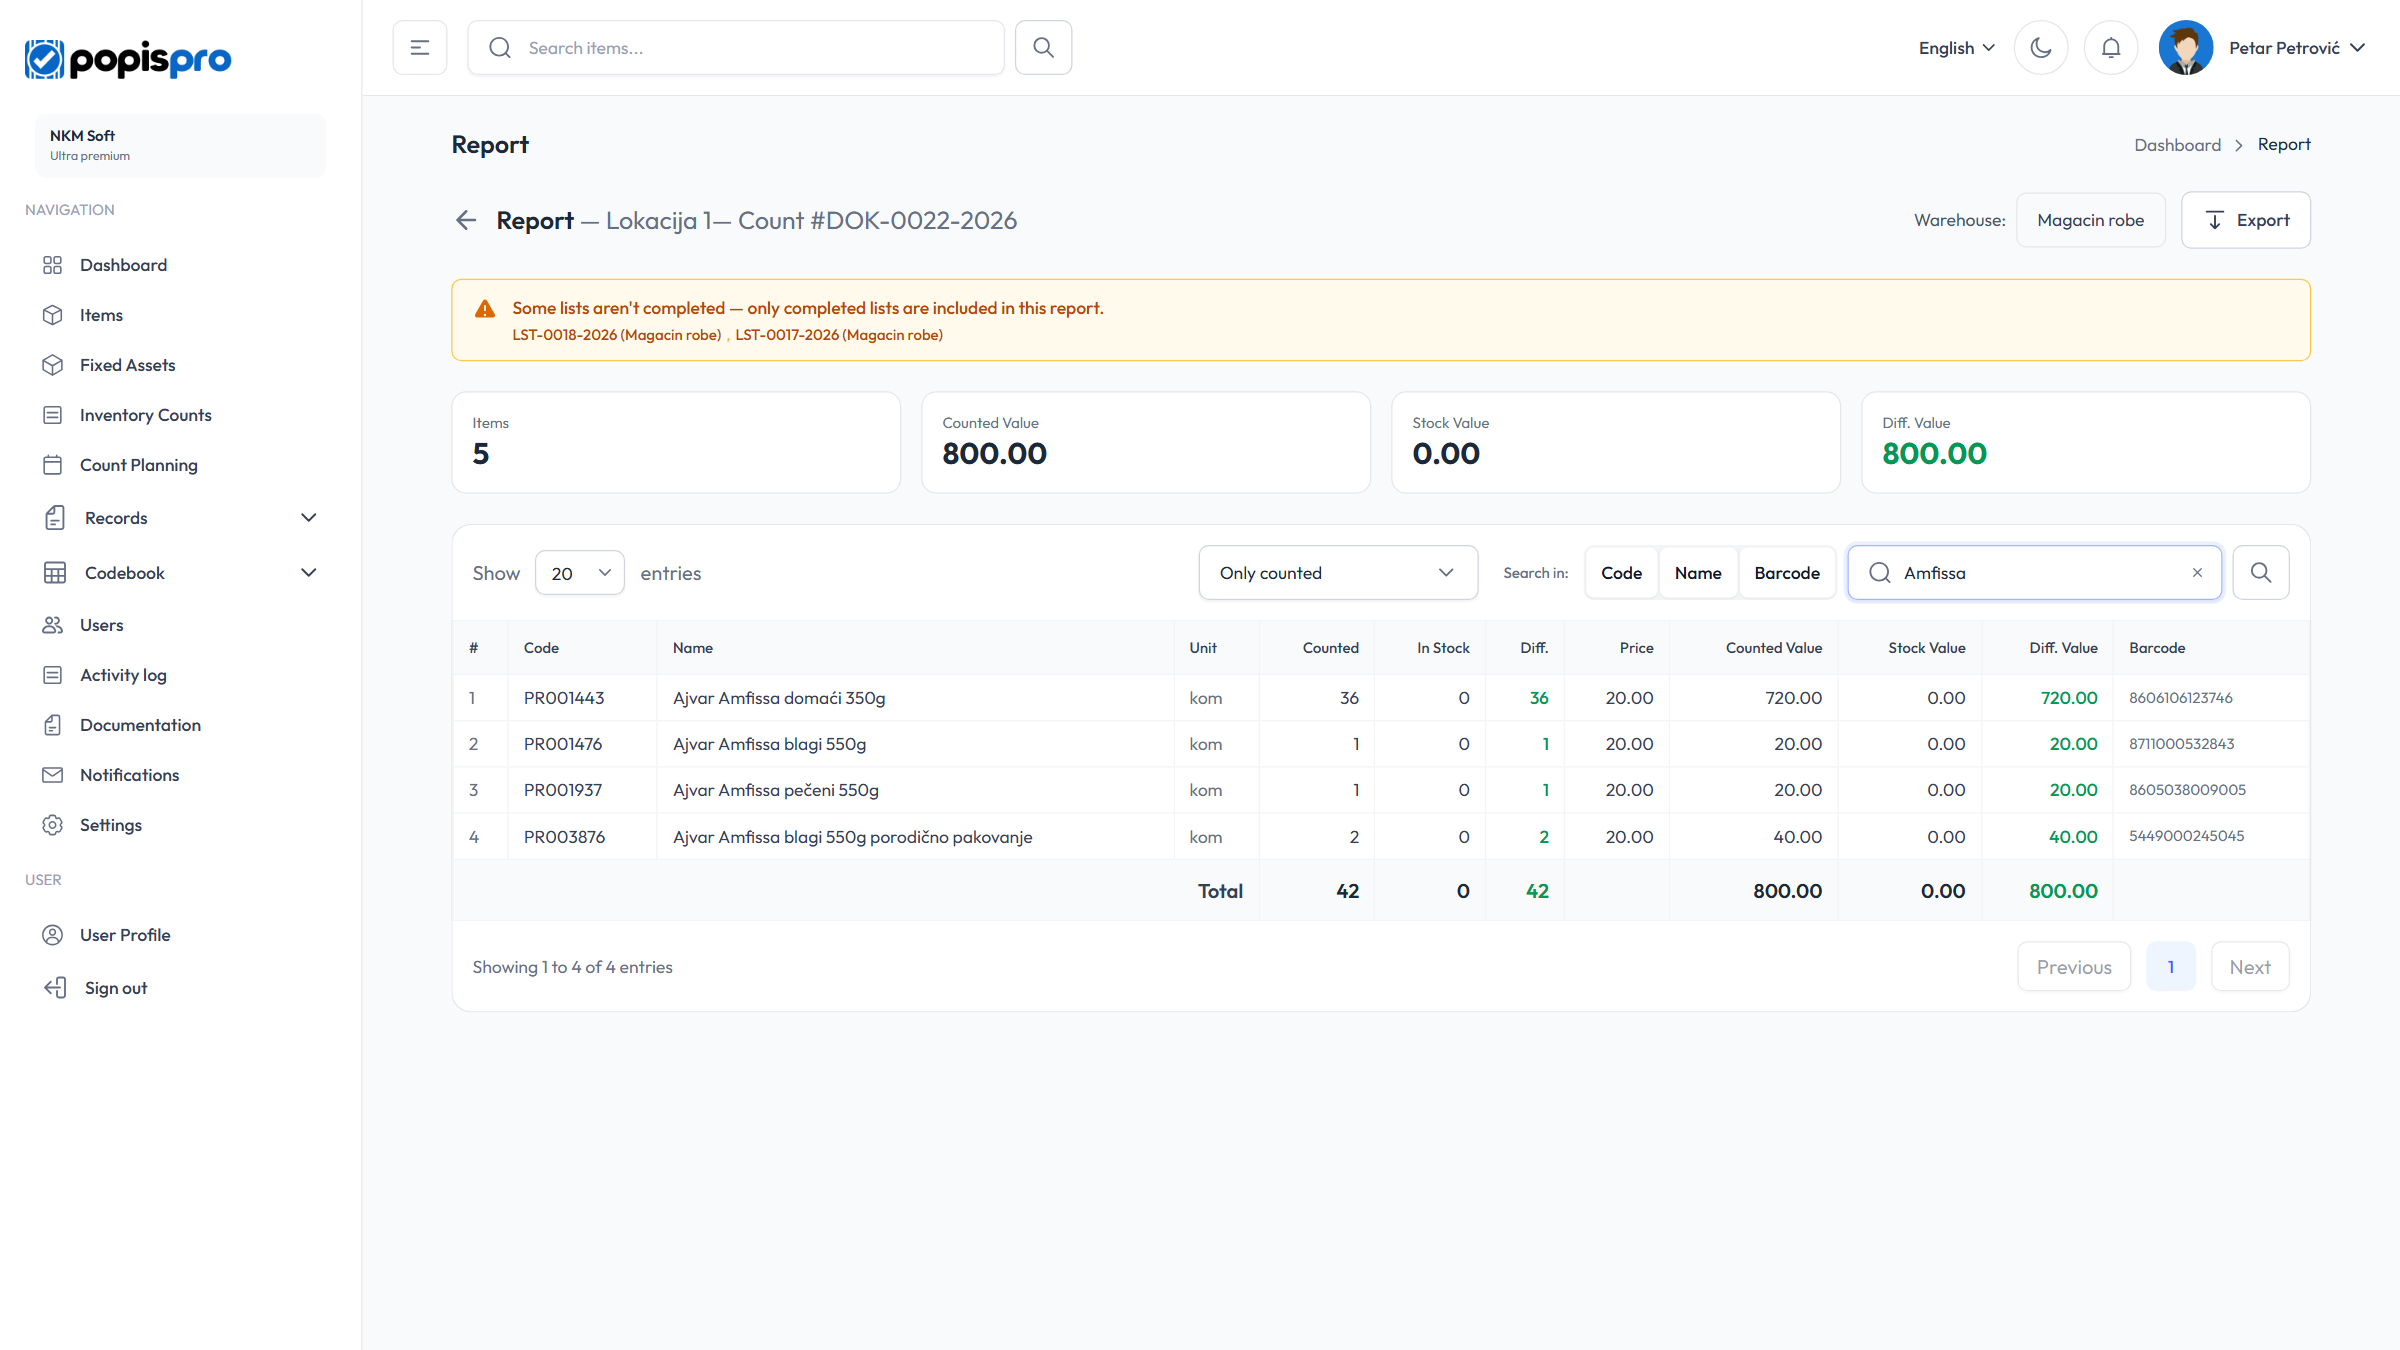
- Only finished lists go into the report. While a list is unfinished, a notice above the table lists them: Some lists aren't completed — only completed lists are included in this report.
- Warehouse: picks a warehouse when the count covers all of the location's warehouses.
- The tiles at the top: Items, Counted Value, Stock Value and Diff. Value. The Items tile follows the chosen view.
- The dropdown before the search box picks which rows the table shows:
- All items — counted and uncounted; under Items are then the labels N uncounted items (items expected but not counted) and, for fixed assets, N duplicates (the same asset on several lists);
- Only counted — just what's on the lists;
- Uncounted Items — just what's expected but wasn't counted;
- Duplicate in lists — fixed assets, when there are any.
- The report opens on All items when the warehouse has its stock entered. When it has none, every catalogue item would show as uncounted, so it opens on Only counted.
- Search uses the fields chosen in Search in (Code, Name, Barcode) when you press Enter or click the magnifier.
The table columns:
| Column | Content |
|---|---|
| Counted | The total quantity from all finished lists. |
| In Stock | The warehouse stock (for fixed assets: the asset's quantity). |
| Diff. | Counted minus stock: positive is a surplus, negative a shortage. |
| Price, Counted Value, Stock Value, Diff. Value | Quantities multiplied by the price. |
Uncounted rows are yellow and duplicates red; for duplicates, the Counted in links open the lists where the asset appears.
Note
Once the count is completed, the In Stock, Diff., Stock Value and Diff. Value columns are no longer shown: warehouse stock changes over time, so the difference would be wrong. If you need the differences, export the report before completing the count.
Exporting the report
Export offers Excel (.xlsx), CSV (.csv), PDF (.pdf) and the formats for business software (Excel 97-2003, OpenDocument, XML, Code;Quantity and PETCOM). The file follows the chosen warehouse and view (All items, Only counted…), and Excel, CSV and PDF have the same columns as the table. The Excel export (.xlsx, and also .xls and .ods) also has a second sheet, Serials / Lots, when serial numbers, lots or positions were entered on the lists — one row per serial number or lot, with the list, position, serial number, lot, lot quantity and expiry date.
The PDF starts with the count's details and totals, with the warning Some lists aren't completed — only completed lists are included in this report. when that applies; then come the items, and the serial numbers, lots and positions as a second table at the end.
Analysis
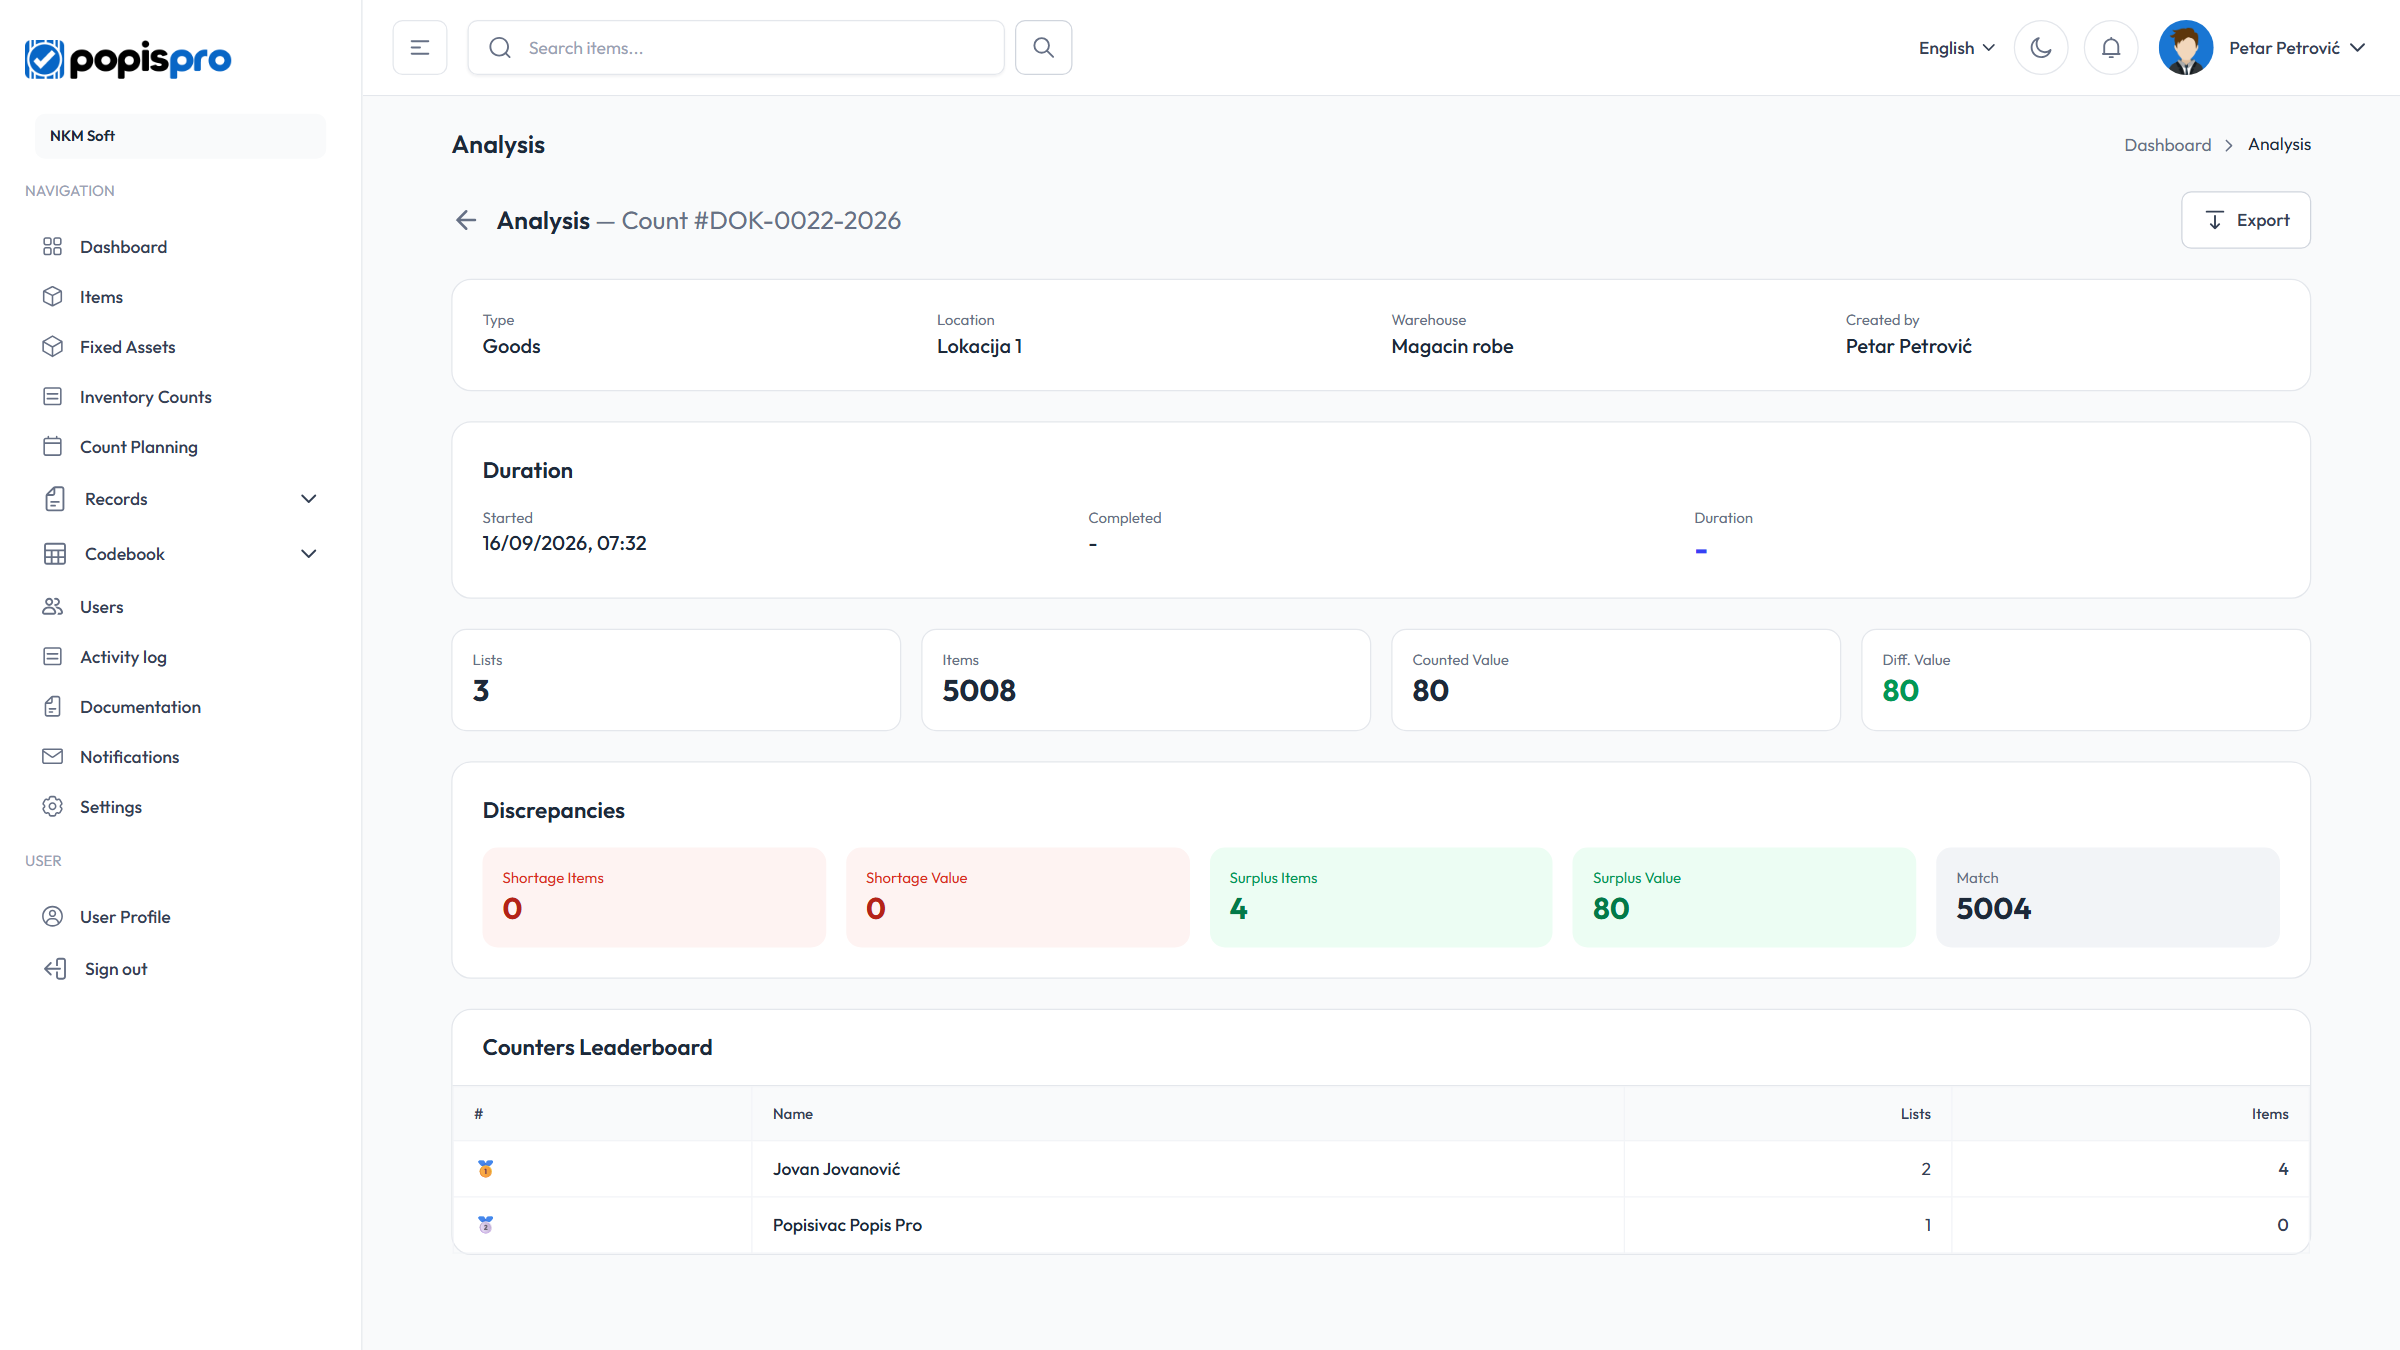
- Duration: start, completion and the total duration of the count.
- Tiles: number of lists, number of items, counted value and difference value.
- Discrepancies: Shortage Items, Shortage Value, Surplus Items, Surplus Value and Match.
- Counters Leaderboard: how many lists and items each user counted.
Export in the analysis creates an Excel file with Summary and Counters sheets, a CSV with the summary, or a PDF with the summary followed by the counters table. Once the count is completed, discrepancies aren't shown, for the same reason as in the report.